
A recent survey on income per Uber driver's gender was performed by Uber and Stanford University. The survey concluded that women earned 7% less than men, so let's take a look at the reasons why.
To start off, the survey provided Uber with a lot of data regarding their driver's performances, and this data covered years 2015 to 2017. It included the following interesting information; the hourly pay per driver, how many active drivers there were, the way driving experience affected the driver's income and the contractual period that drivers maintained after application approval.
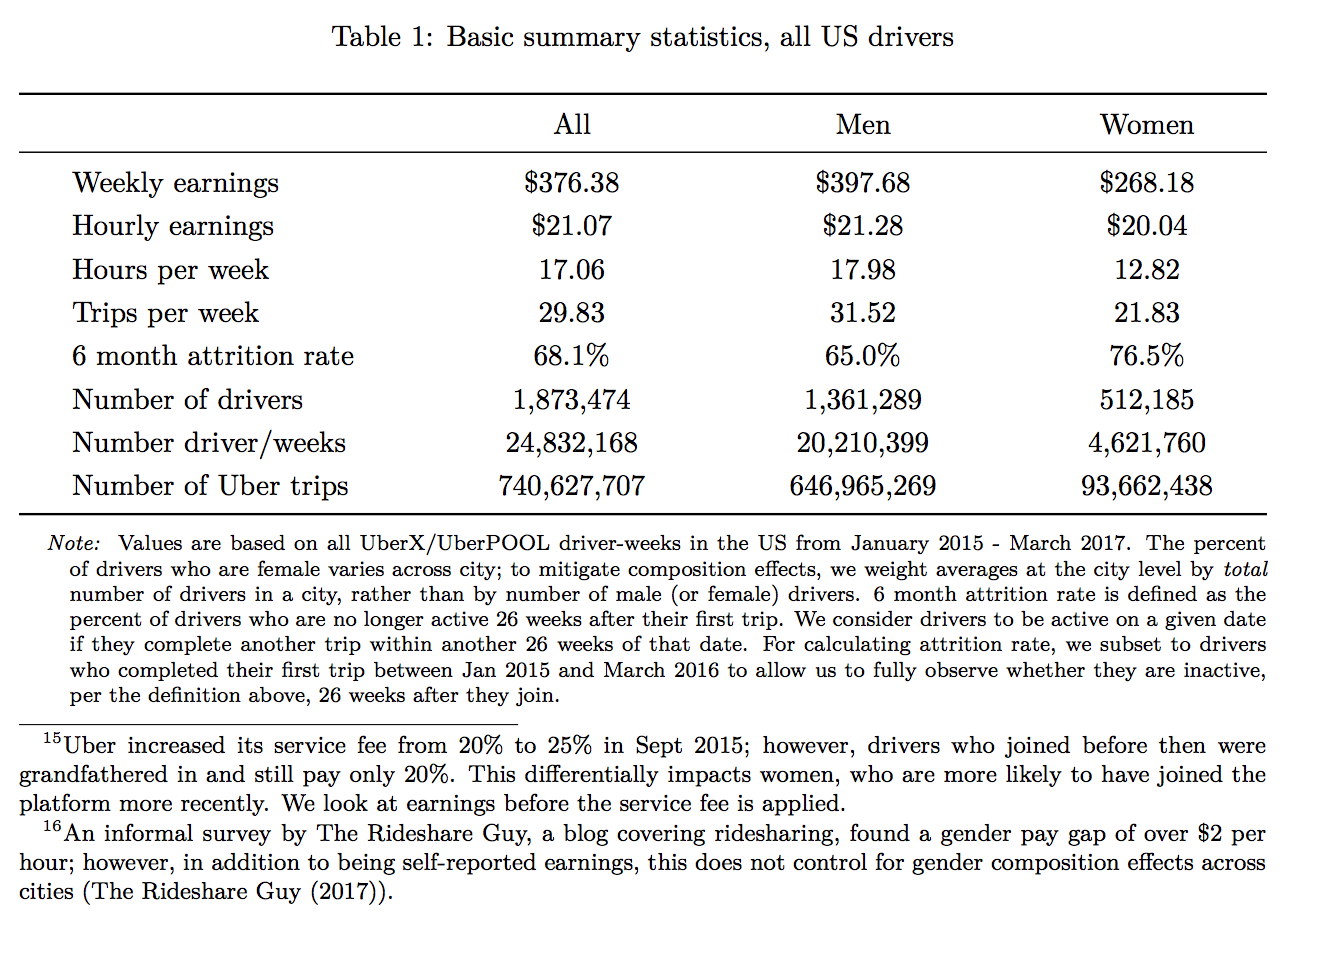
Facts (Minor differences or none at all between genders):
- Uber Had 1,873,474 Drivers in February of 2017
- Around 68% of all driving applicants stopped driving for Uber within 6 months.
- Within 26 weeks of starting to drive, 65% males and 76.5% female drivers became inactive. This fact is a bit ambiguous since it did not set a definition for inaction. In effect, if you performed one ride per month, then you were active. So, the number of active drivers could be a little bit exaggerated according to this fact.
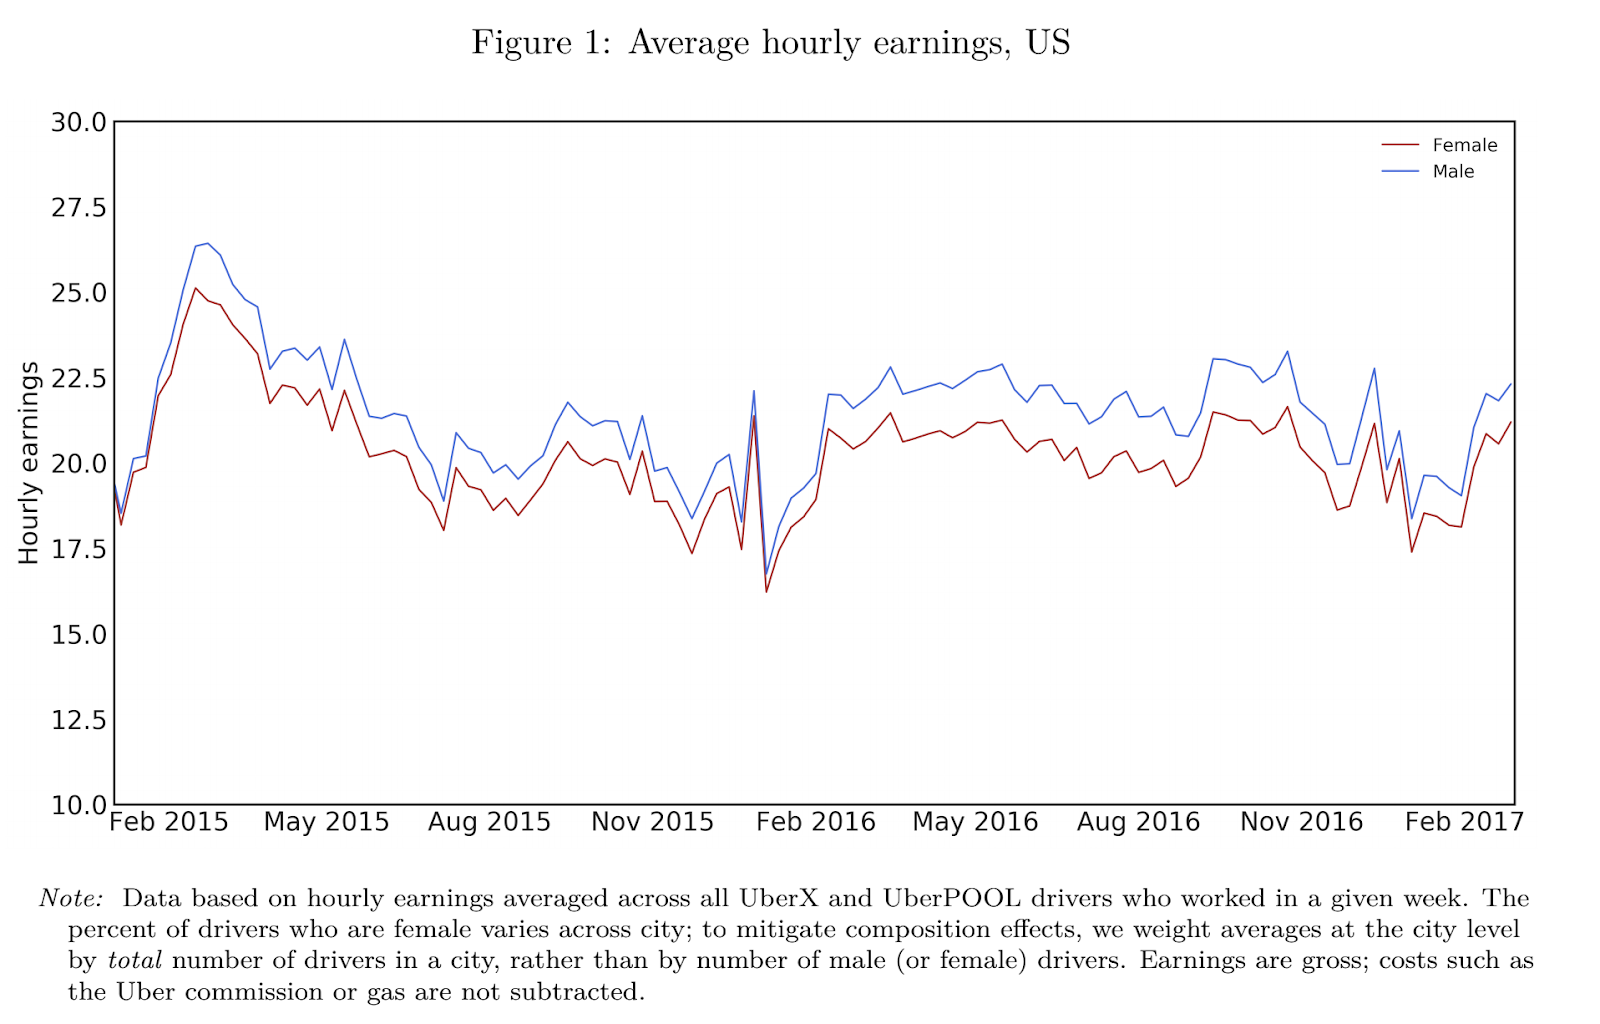
- Average Hourly Pay Was Only Around $16/Hour. This is based on the survey's gross pay that included the Uber fee in it. Since the Uber fee is around 20-25%, the gross figure of $21.07 is closer to $16 with a 5% tolerance either way. If you decide to be picky and add an average expense, then the net income per driver is closer to $11 with a 5% tolerance either way.
- In January 2015 and January 2016 there is a dip in income. This fact could be based on two sources, the first is the seasonal issue, where drivers ten to phase out a bit after the long December hours. The other reason is the Uber driver pay cut's which were nationwide and equaled around 15%.
- The February spikes are most probably caused by Uber's pay promotions and the fact that drivers tend to return to active duty in-force.
- The Winter warm-ups for 2015 and 2016, between February and April, are mainly due to the new Uber guarantees and incentives that Uber pushed out both periods.
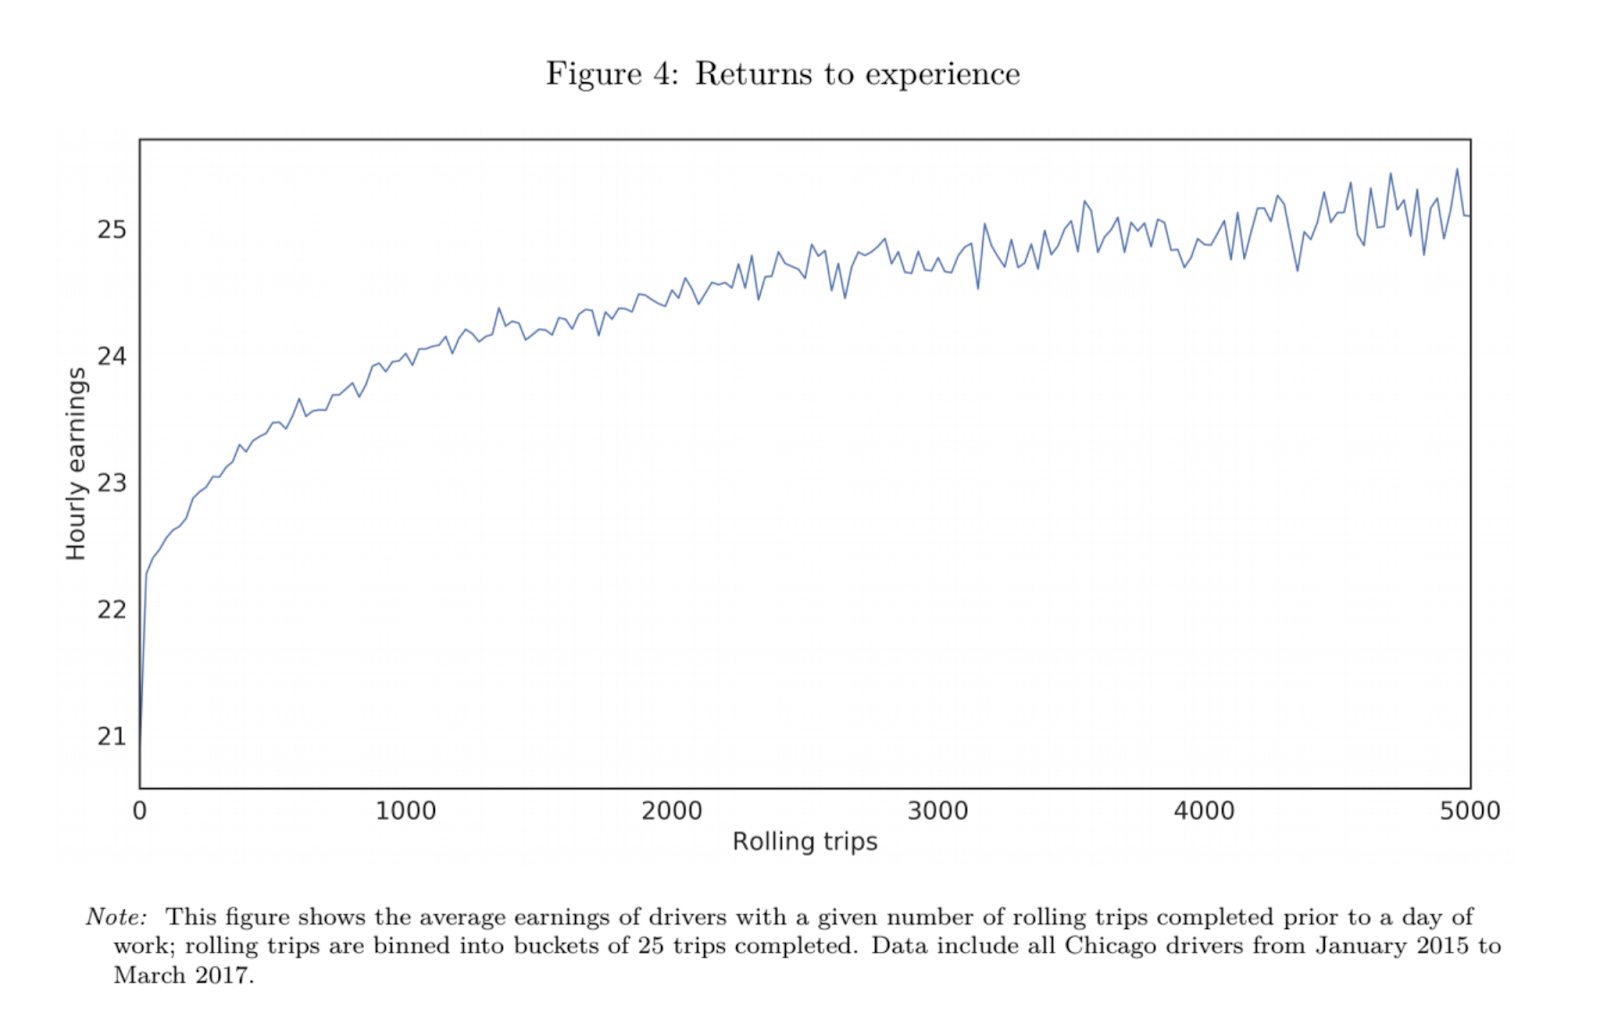
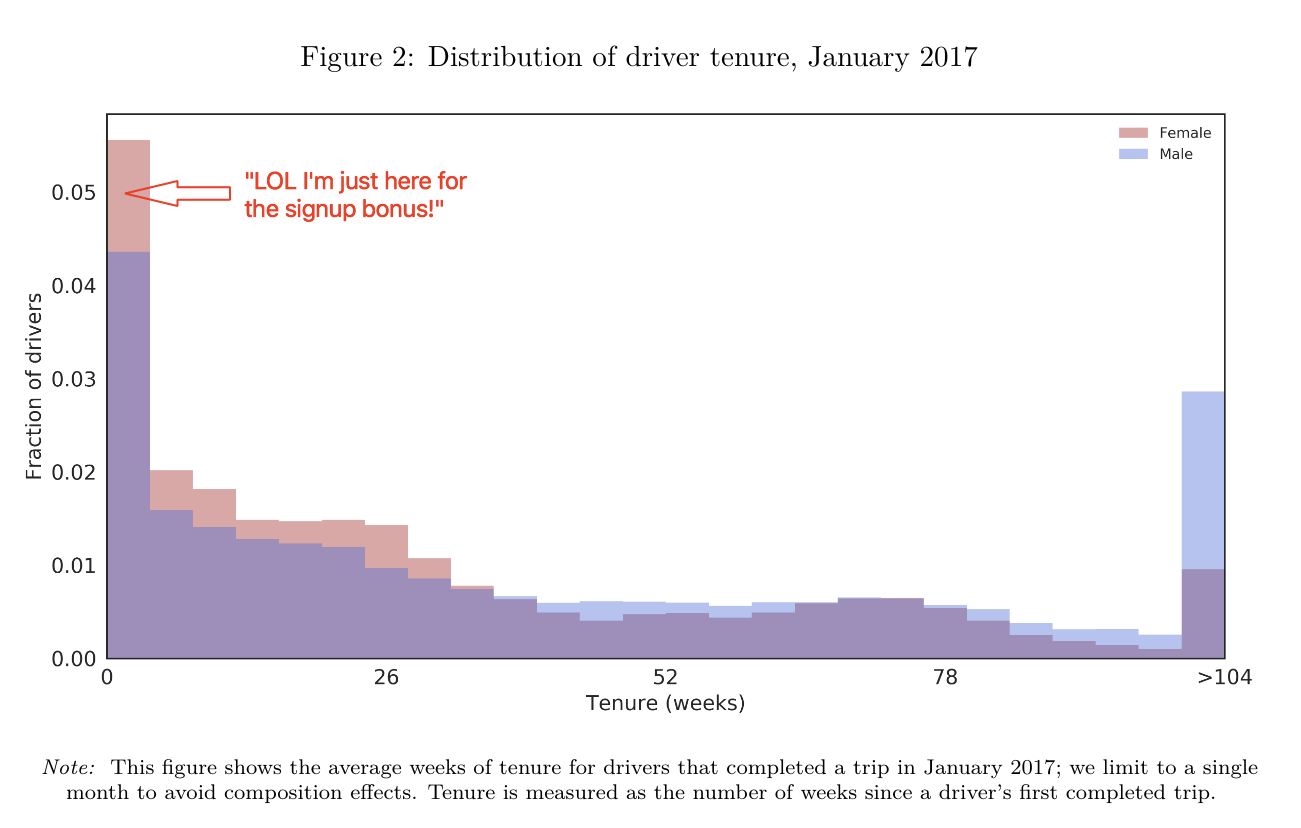
- Driver Experience showed that the seniority of drivers in January 2017 where the majority of the drivers were driving for under 26 weeks. There are a lot of drivers that only came on for the sign-up bonus and then stopped driving after they reached their limit. You will also learn about the number of drivers with over 2 years' experience, and the fact that drivers with over 2,500 rides under their belt tend to earn around 14% more than the inexperienced.
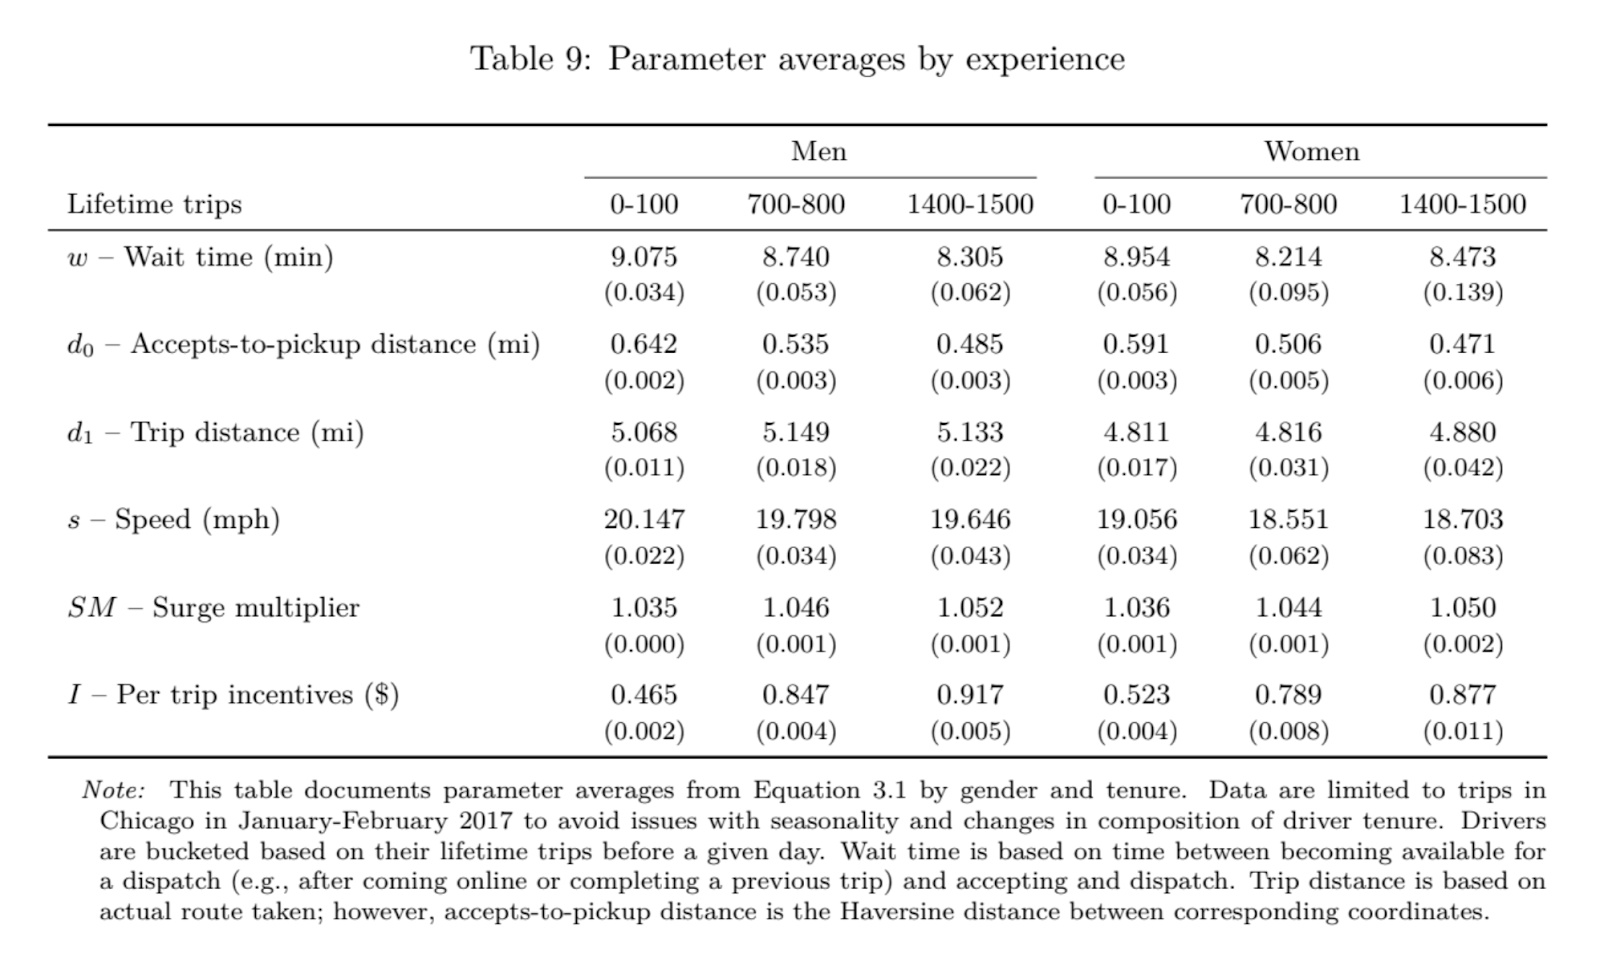
- Experienced drivers learned how to utilize the cancellation policy better than inexperienced.
- Waiting time was also longer for inexperienced drivers irrespective of their gender.
- Distance from request to accept to pick up went down; this means that the more experienced drivers knew how to accept rides strategically. This goes hand in hand with the cancellation fact, where the more experienced knew how to cancel rides based on experience selectively.
- The speed men drove was faster than women, the reason why this could be due to the psychological difference in how women drive (protectively) to men (aggressively).
- The more experienced drivers knew how to handle the surge map better and forecast when a surge would happen and where.
- Incentive driving is a learned skill, where experienced drivers (over 700 rides) would earn around double from an inexperienced driver (under 100 rides). The difference between earning $0.917 to $0.565 per trip.
Facts (Differences between gender) that generated the 7% gap
- Women tend to drive at different times to men, which is a major contribution to income differences.
- Women tend to drive shorter shifts then men, so obviously, this contributed to the difference.
- Women's driving speed was slower than men, and this contributes to the accumulated number of rides a woman will make a shift. Since women tend to drive shorter shifts then men, the income is therefore lower.
- Women tend to be less experienced then men in driving for Uber, there was a higher drop rate for women, so more experienced drivers were men.
Harassment issues
The study did not consider the number of sexual harassment issues that women drivers go through, these will shake up the driver and she would either stop the shift, stop working for Uber, or if continuing to drive, would not perform as she did before. The sexual harassment issue should be analyzed closer to provide a more accurate result.
Tipping
This was not included, so we do not have any facts about the difference in tipping between men and women drivers, this could be an interesting fact. Do women get better tips than men? Would this tip the scales in favor of women? After all, most tips are above 7% of the fare value, although not every ride is tipped, which leads us to ask, how many rides are tipped per shift and what is the percentage of the total per shift?
Conclusions
The study did not state that women earn 7% less than men per fare, only that they earned 7% less than men per shift. This is a correlation between shift, driving styles and safety issues (that did not come up in the survey). Basically, women earn the same as men but drive differently, and this is the main cause of their lower income per shift when compared to a male counterpart.